By Nina Hong, Ph.D., applications physicist, J.A. Woollam
Modern electronics are becoming thinner, lighter, more conformable, bendable or rollable. You now can fold your smartphone to fit in small pockets. You can wear your electronic devices to check email or monitor your daily physical activity. Augmented, Virtual and Mixed Reality (AR/VR/MR) devices allow you to experience engaging virtual or fictional reality, such as flying over the Eiffel Tower or catching virtual monsters in your backyard. This firm has received many recent requests to characterize flexible substrates, such as flexible glass, polymer sheets, metal foils and even flexible ceramics as these industries grow. In this article, we present interesting case studies demonstrating the power of spectroscopic ellipsometry for flexible substrates and their devices.
Flexible polarizing elements
Ellipsometry measures the change in light polarization induced by a sample at a measurement angle. When the sample is designed to alter the input polarization in a specific way, ellipsometry measurements can evaluate the polarizing effect often without rigorous modeling. We first will look at three different flexible, polymeric optical elements that are commonly used in optical devices to create phase shifts or filter beams to produce linear or circular polarizations. We will introduce useful software features to demonstrate how spectroscopic ellipsometry determines the sample’s polarizing properties, such as retardance, polarization-dependent intensities, azimuth and ellipticity.
1. Linear retarder
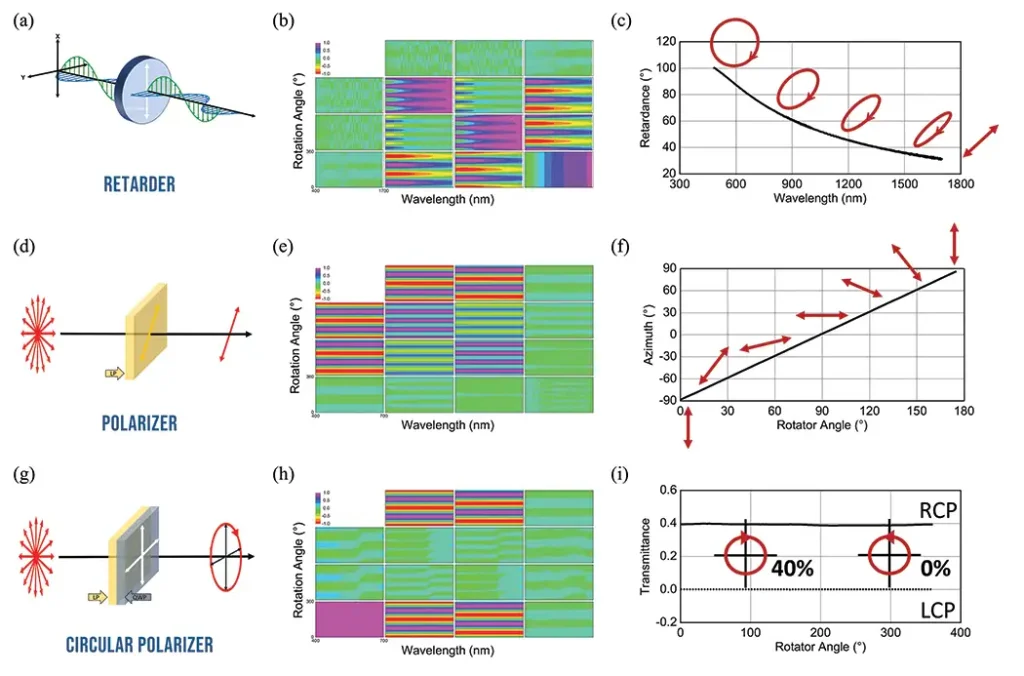
A linear retarder delays one component of an electric field relative to another orthogonal component, creating a phase shift (δ) between two orthogonal, linear polarizations. The phase shift is caused by the index difference between the two orthogonal directions, as shown in Figure 1(a). Phase shift is specified in degrees, waves, radians or nanometers and often is referred to as retardance. The most common optical element that produces retardance is a waveplate. For example, a quarter-wave plate is designed to create a retardance of 90°, and a half-wave plate is designed to produce a retardance of 180°.
Figure 1(b) shows the spectroscopic, Mueller-matrix ellipsometry data for light transmitted through a polymer thin film (~75 µm). The x-axis is the wavelength range, and the y-axis is the angle of rotation around the sample normal. The polymer film is optically biaxial, creating a phase shift between the x and y directions. The effect of the linear retardation fills the lower right 3×3 block of the Mueller matrix.
The retardance model in this firm’s available software platforms provides a push-button solution to characterize linear retarders. It uses matrix diagonalization algorithms to extract linear retardance from generalized spectroscopic ellipsometry data. The wavelength-dependent retardance of the polymer film is extracted from the retardance model in Figure 1(c). The output polarization at different wavelengths is drawn in red to illustrate the effect of the retarder on an incident 45⁰ linear polarization. The result reveals that the retardance converts linearly polarized light into elliptically polarized light. Near 500 nm, the polymer sheet acts as a quarter-wave plate, and linear polarization is converted to circular polarization. Retardance is determined by the index difference multiplied by the path length through the retarder. Therefore, adjusting the polymer sheet thickness is a convenient way to create a quarter-wave (or half-wave) plate at a specific wavelength.
2. Linear polarizer
Polarizers commonly are used in sunglasses, camera filters, window coatings or display devices. Linear polarizers transmit the electric field vibrating parallel to the transmission axis and reject (either absorb or reflect) the orthogonal electric field, which is parallel to the extinction axis, as illustrated in Figure 1(d). This direction-dependent intensity attenuation is referred to as diattenuation. Linear diattenuation fills the upper left 3×3 block of the Mueller matrix, as shown in Figure 1(e).
Like the retardance model, the Mueller-matrix-derived parameter in this firm’s software provides a convenient way to extract useful parameters for optical elements, including linear polarizers. This feature calculates the output Stokes parameters based on a user-defined input polarization. As a result, the user can access useful polarizing or depolarizing parameters, such as azimuth, ellipticity, degree of polarization, percent depolarization and polarization-dependent intensities.
Figure 1(f) shows the derived azimuthal angle of the transmitted polarization through a 94-µm-thick polymer polarizer as it rotates around the sample normal. Measuring the azimuth and ellipticity without needing additional optical elements, such as another polarizer or a quarter-wave plate, is beneficial to monitor the polarizer’s performance and uniformity in a device.
3. Circular polarizer
The third optical element is a circular polarizer made of two flexible polymer sheets attached in series: a quarter-wave plate and a linear polarizer [1]. This device shows different optical responses and measured ellipsometry data depending on the direction of light travel. We refer to this as an inhomogeneous optical element [2], which produces nonorthogonal eigenpolarizations.
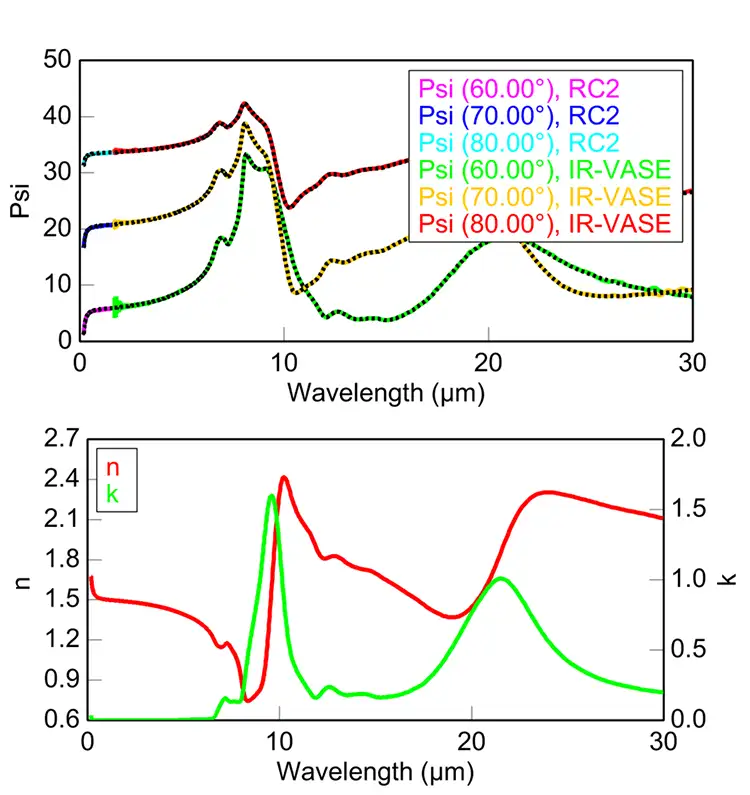
Figure 1(g) shows the optical response of this device in the forward direction where the beam enters the linear polarizer first and then the quarter-wave plate. The fast axis of the quarter-wave plate is rotated by 45⁰ from the transmission axis of the linear polarizer. Unlike homogeneous optical elements, the resulting Mueller matrix does not exhibit symmetrical behavior. This forward direction converts unpolarized light to circularly polarized light, which is used as a circular polarizer. The m41 Mueller-matrix element (=1) in Figure 1(h) shows the circular-polarizing effect. Figure 1(i) shows the output Mueller-matrix-derived transmittance for each circular polarization. Twenty percent of the light is reflected from the surface. Of the remaining light, nearly half (40%) passes through the device and is polarized to right circularly polarized light, and the other half is absorbed. Circular polarizers are used in front of camera lenses for better photographic images. Although not shown here, the reverse direction will filter incoming circularly polarized light according to its handedness, allowing interesting optical devices such as 3D stereoscopic glasses [1].
Complex index of refraction
Spectroscopic ellipsometry is a powerful metrology tool to measure the complex index of refraction (n and k) of materials over a wide spectral range. This firm’s instruments can measure wavelengths ranging from vacuum ultraviolet (140 nm) to far-infrared (30 µm) and, more recently, the terahertz (3 mm) range. The wide spectral measurement allows the determination not only of refractive index but also bandgap energy, electronic transitions, molecular vibrations, light absorbance, stress birefringence, crystallinity, composition and more.
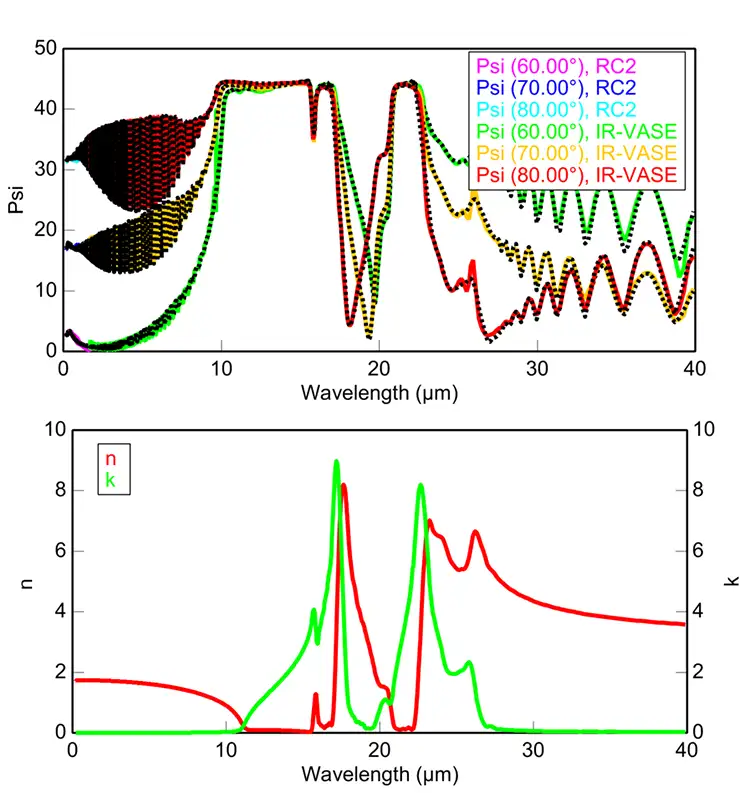
Figure 2 shows the spectroscopic-ellipsometry data and modeling results for a 100-µm-thick flexible glass (via Corning®) measured on the RC2 and IR-VASE spectroscopic ellipsometers. The glass is transparent in the UV-VIS-NIR and absorbs in the IR. The IR results reveal absorption related to molecular vibrations, such as Si-O-Si bonds near 9.3 µm and Si-O bonds around 22 µm. In general, flexible glass samples are easy to work with for ellipsometry characterization thanks to their isotropic nature, smooth surface and low haze.
This firm recently has come across thin ceramic sheets that offer flexibility, great thermal stability and wear resistance. Challenges for these materials include natural brittleness and surface scattering. Figure 3 shows the ellipsometry results for a 40-µm-thick Corning® alumina-ribbon ceramic substrate produced by a continuous-sintering ceramic process. The index of refraction of the ceramic is higher than that of the flexible glass in the UV-VIS-NIR: n of alumina = 1.743 and n of glass = 1.512 at 632.8 nm. In the IR region, the ceramic shows complex molecular vibrations due to Al-O bonds. Because the ceramic is thin, the light reflected from the front and back surfaces will combine coherently, creating a thickness interference pattern in the transparent region (<10 µm and >27 µm). This allows the sample to be treated as a free-standing film, and its thickness can be measured optically. Figure 3 shows an excellent match between the model and measured data, especially to the many interference oscillations.
The following sample series are isotropic or weakly anisotropic polymer films, such as polypropylene (PP), polyethylene terephthalate glycol-modified (PETG), polyethylene (PE), polycarbonate (PC), cyclic olefin copolymer (COC), poly(methyl methacrylate) (PMMA or acrylic) and thick cellulose triacetate (TAC). Thin polymer sheets are very flexible, shatterproof and inexpensive, and most have a low melting point. If they are transparent and isotropic, the ellipsometry analysis strategy is as straightforward as for a glass substrate. Some of these polymer sheets can be difficult to measure in reflection mode due to uneven surfaces, low reflectivity or scattering leading to low signal intensity.
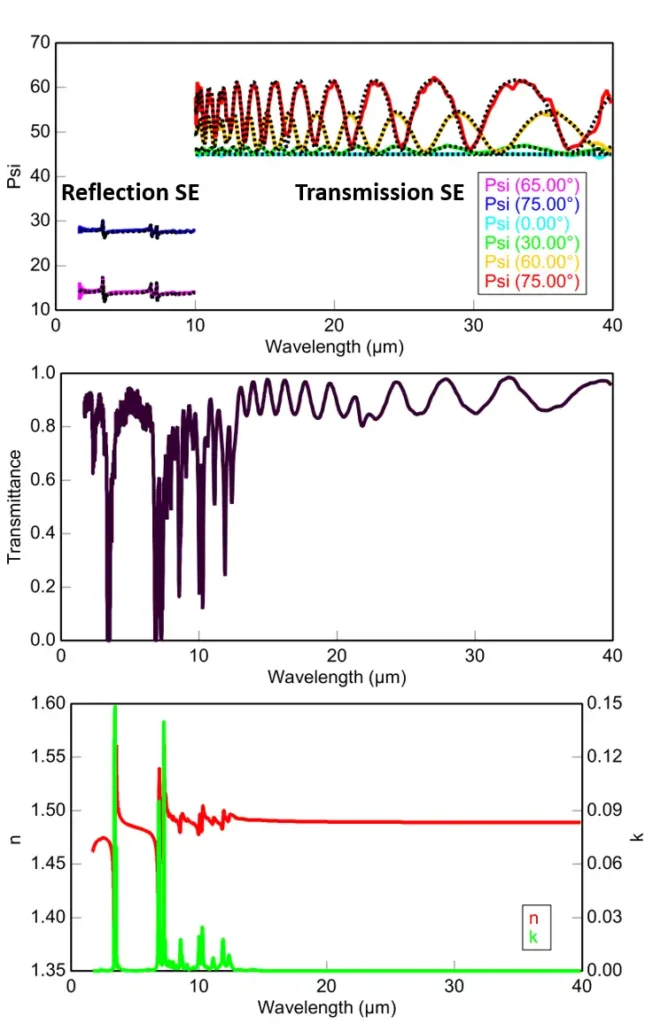
If these problems occur, the index of refraction can be measured by measuring the sample in transmission. An example of a 66-µm-thick polypropylene sheet is shown in Figure 4. We used the reflection mode SE data for wavelengths below 10 µm and the transmission SE data for wavelengths above 10 µm. Additionally, appending the transmission-intensity data improved the sensitivity to very small absorptions. Using the multiple datasets, we obtained the Kramers-Kronig-consistent complex index of refraction of polypropylene over a wide spectral range from 210 nm to 40 µm.
Anisotropic flexible substrates
Many flexible-polymer substrates exhibit optical anisotropy due to intrinsic or stretch-induced molecular chain orientation such as polyethylene terephthalate (PET), polyethylene naphthalate (PEN), and polyimide. The anisotropy in polymer sheets is typically uniaxial (nx = ny ≠ nz) or biaxial (nx ≠ ny ≠ nz). When the transmitted beam is acquired, the index difference creates interference oscillations in the ellipsometry data. This is because the long path length through the sample and the index difference creates a phase shift. When there is an in-plane anisotropy (nx ≠ ny), the ellipsometry data varies depending on the measurement orientation. For anisotropic polymer substrates, generalized or Mueller-matrix spectroscopic ellipsometry data are best suited for measuring cross-polarization between the p- and s- waves.
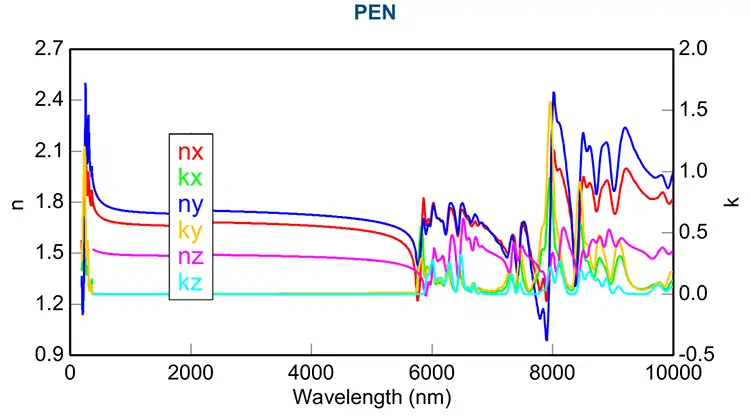
Figure 5 shows the modeling results on a 50-µm-thick PEN substrate from 190 nm to 10 µm. Data analysis in the transparent region uses variable-angle transmission ellipsometry data where the influence of index differences and sample orientation are evident. An increased number of fit parameters in the absorbing region easily produces high parameter correlations. However, we can break this correlation by analyzing ellipsometry data from several different orientations at the same time. A more detailed description of ellipsometry modeling for various flexible polymer substrates can be found in this firm’s publication [3].
Conclusion
Most ellipsometer users are familiar with modeling rigid substrates. Few have experience applying substrate-modeling techniques to flexible-substrate characterization. In this article, we tried to fill the gap by introducing various case studies. For flexible optical elements, raw ellipsometry data reveal the sample effects on polarization for flexible optical elements. We introduced the retardance model and Mueller-matrix-derived parameter to extract useful information. We also demonstrated that conventional ellipsometry modeling for finding complex refractive indices is valid for flexible substrates.
However, flexible substrates can have some additional complexity. When the substrate is very thin, ellipsometry data become sensitive to the substrate thickness, and transmission ellipsometry data may be useful. Some polymer sheets exhibit optical anisotropy that requires advanced modeling strategies.
References
- N. Hong and J. N. Hilfiker, “Mueller matrix ellipsometry study of a circular polarizing filter,” Journal of Vacuum Science & Technology B 38, 014012 (2020).
- S-Y Lu and R. A. Chipman, “Homogeneous and inhomogeneous Jones matrices,” Journal of the Optical Society of America A 11, 766 (1994).
- N. Hong, R. A. Synowicki, and J. N. Hilfiker, “Mueller matrix characterization of flexible plastic substrates,” Applied Surface Science 421, 518 (2017).

Nina Hong, applications physicist at J.A. Woollam Co. (Lincoln, NE), received her Ph.D. in Physics at the University of Nebraska-Lincoln. She holds Bachelor’s and Master’s degrees in Physics from Hanyang University in South Korea. Her research focused on room-temperature, solid-state neutron detectors using boron-rich, carbon thin films. Her graduate research involved material characterization using AES, XPS, XRD, XRR, IR/Raman spectroscopy, AFM/MFM and IV/CV measurements. Nina joined the J.A. Woollam in July 2012, where she has been working extensively with anisotropic-materials characterization using Mueller-matrix spectroscopic ellipsometry. Her recent research focuses are developing ellipsometry solutions for flexible optical devices, anisotropic crystals, and metamaterials. Nina can be reached at 402-477-7501, email: nhong@jawoollam.com or www.jawoollam.com.

